Salwarp, Worcestershire · 19 September 2026
A walk down to the Salwarpe
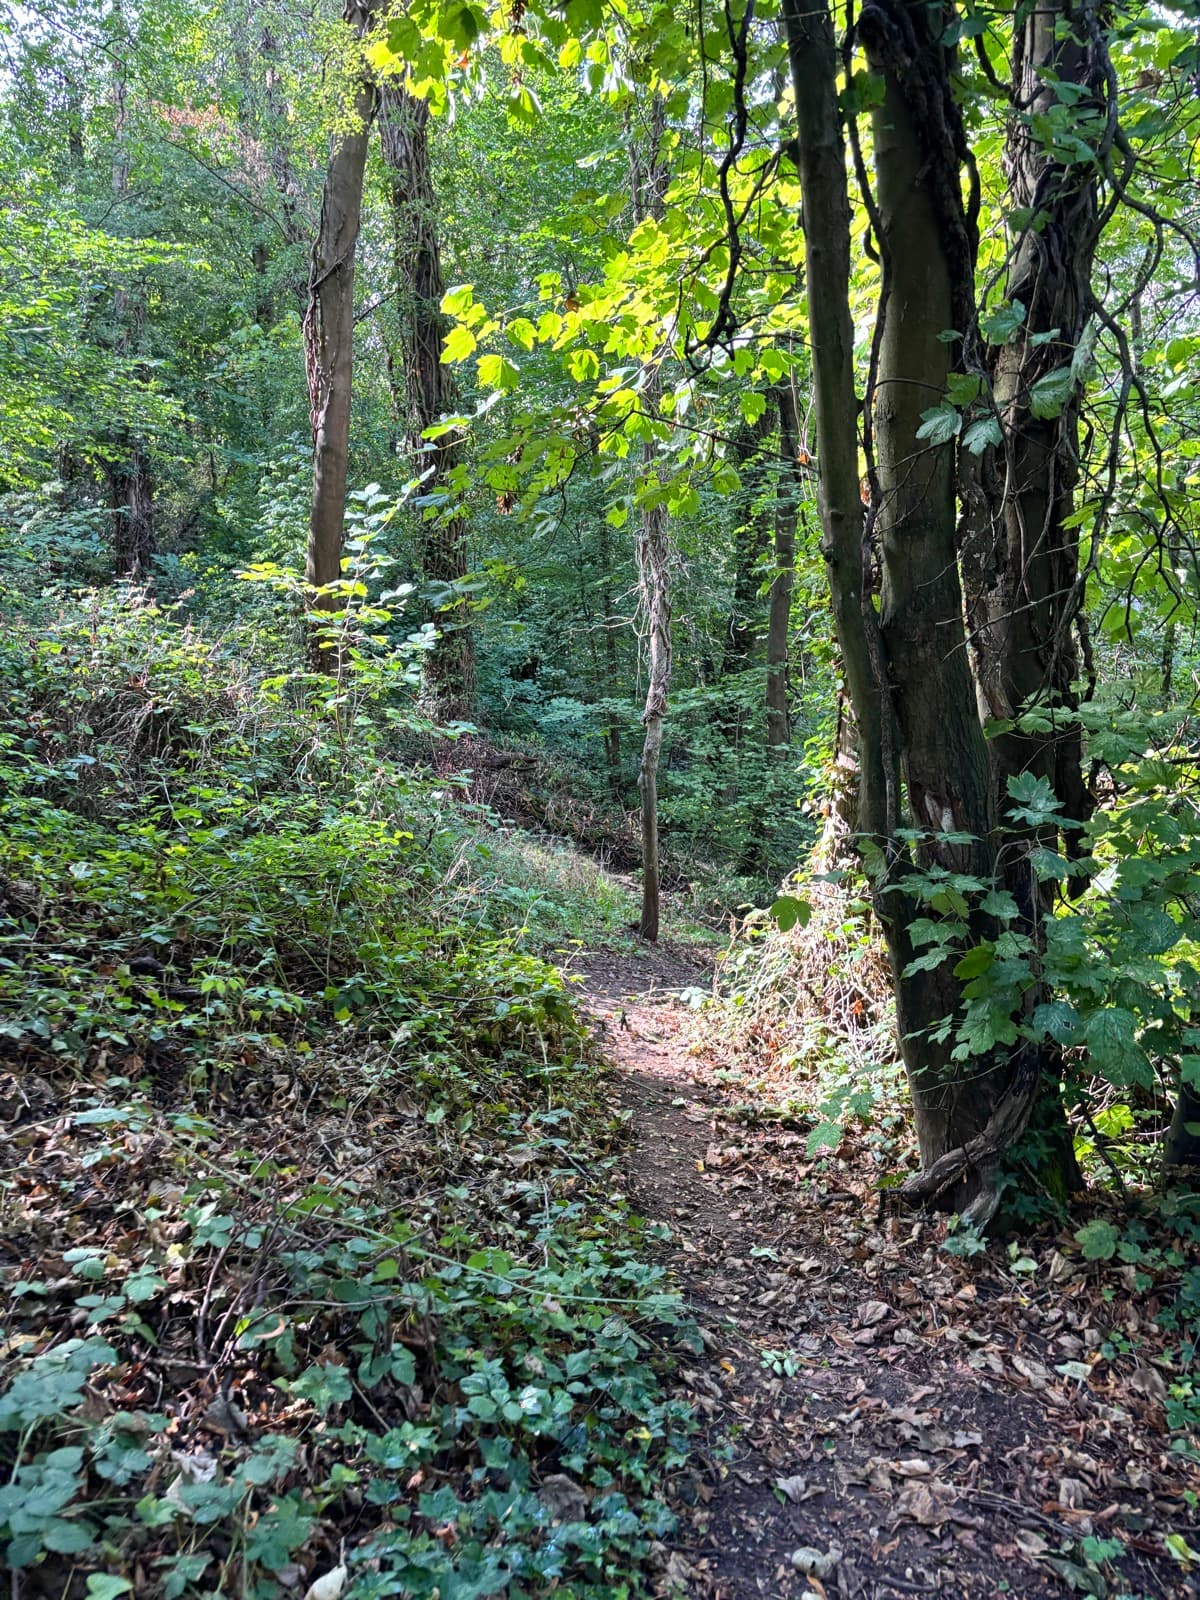
On a bright Saturday lunchtime I walked from the church at Salwarp, down the path towards the river, and on to the canal. I could not reach the water. The path to the river has grown over. These are the photographs, and this is what the official record says about the overflows on that stretch.
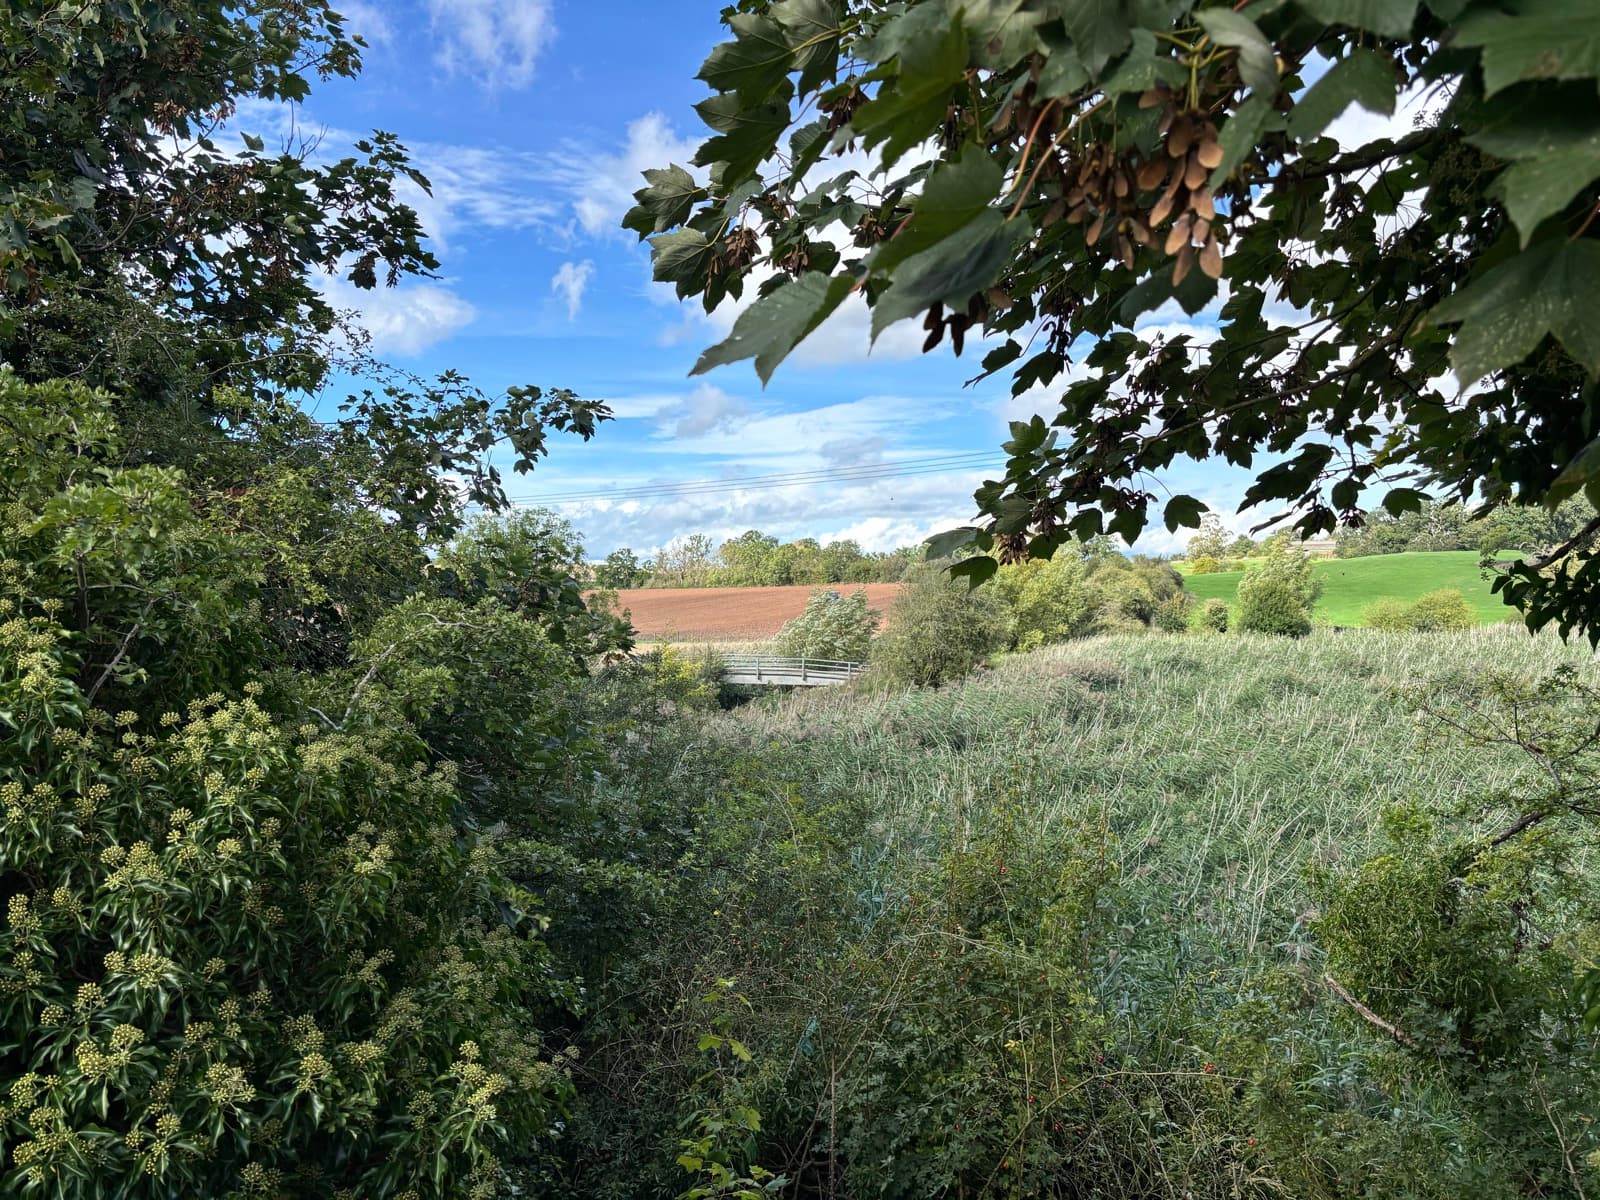
The overflows on this stretch
Within a couple of kilometres of where those photographs were taken, the National Storm Overflow Hub lists these overflows. All are operated by Severn Trent Water. The spill counts are from our own record of the last 30 days.
| Overflow | Receiving water | From the walk | Spills, 30 days | Last recorded spill |
|---|---|---|---|---|
| SVT00794 | RIVER SALWARPE | 1.3 km | 12 | 31 August 2026 |
| SVT00895 | MARTIN BROOK | 2.0 km | 2 | 29 August 2026 |
| SVT02187 | MARTIN BROOK | 2.3 km | 6 | 13 September 2026 |
| SVT02643 | RIVER SALWARPE | 2.8 km | 4 | 30 August 2026 |
| SVT00695 | RIVER SALWARPE | 3.5 km | 2 | 30 August 2026 |
| SVT02315 | CROWLE BROOK | 5.6 km | 1 | 29 August 2026 |
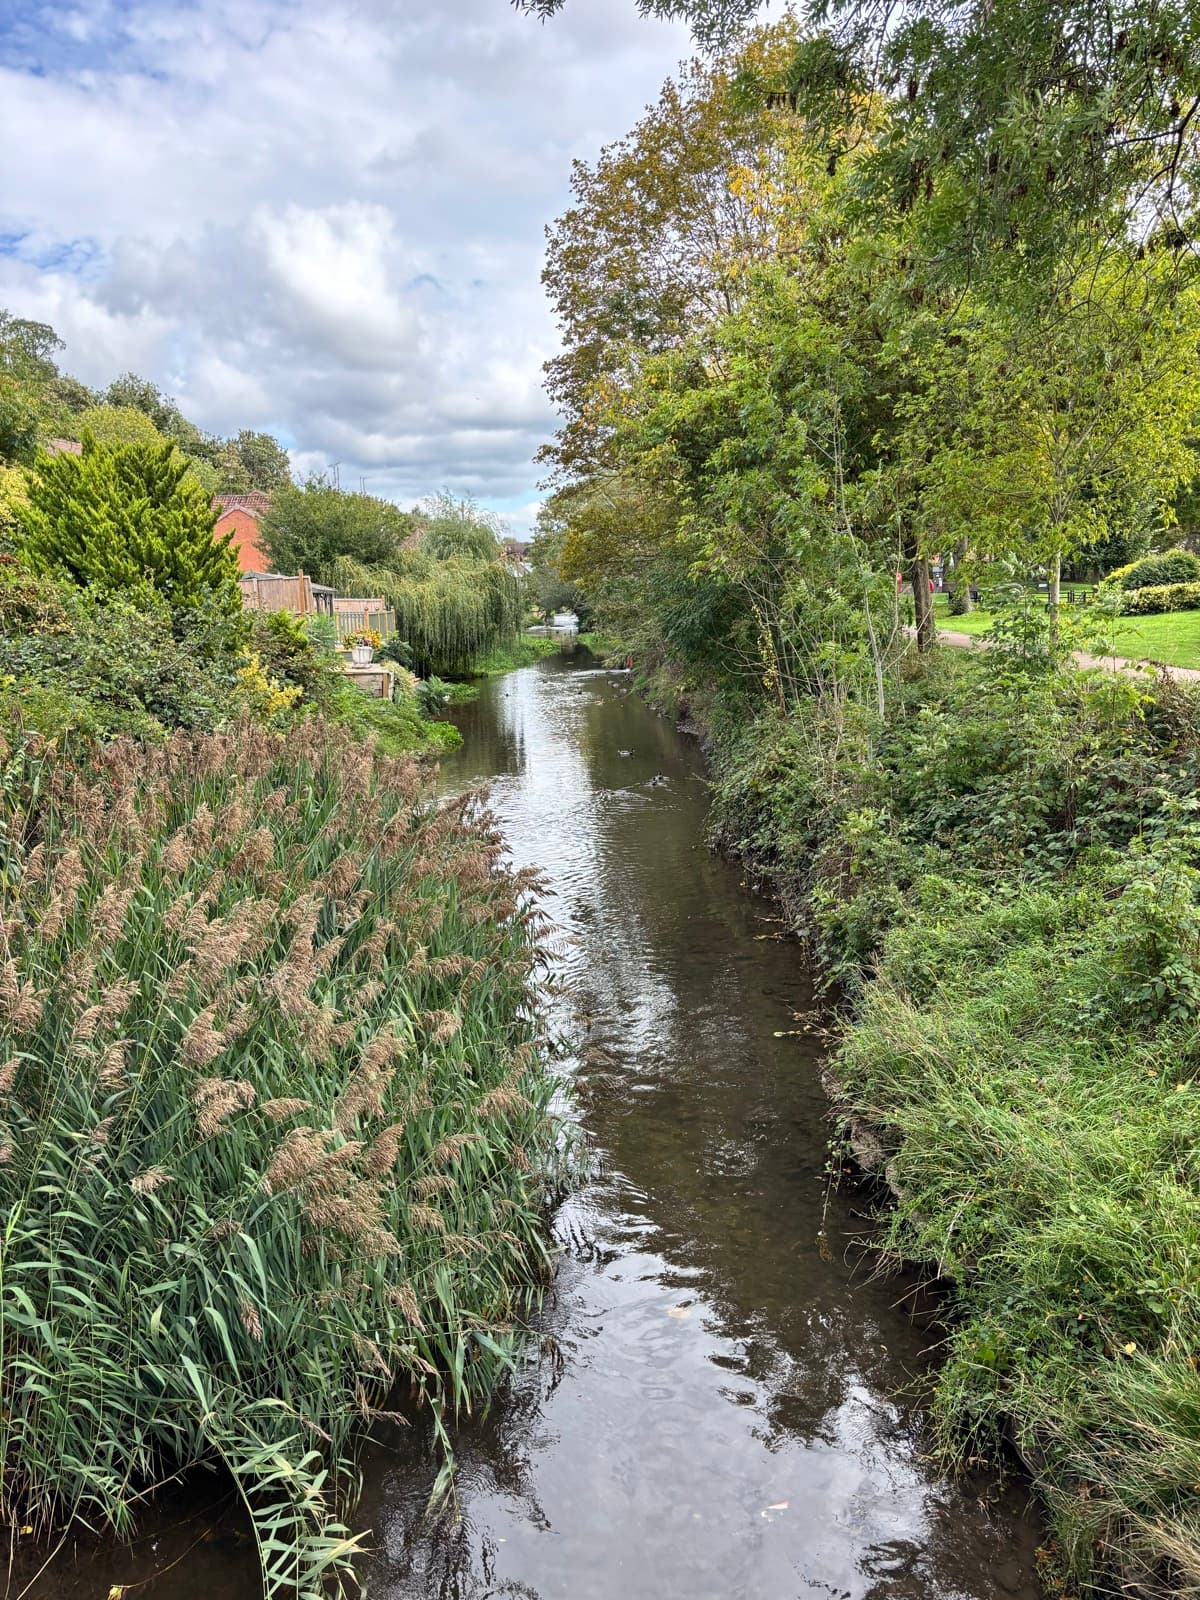
Five years on the Salwarpe
Each year the water companies report every storm overflow to the regulator: how many times it spilled and for how long. These are the totals for overflows whose receiving water is recorded as the Salwarpe.
The heaviest year in that record is 2024: 180 spills and 1,443 hours of discharge, across the overflows on this watercourse.
What this is and is not
The photographs were taken on one walk, on one day, and show only that the path is overgrown. They are not evidence of pollution. The figures beside them are official records: the companies' own spill reporting, and their annual returns to the regulator. We reproduce those records and say how we computed from them. We do not assert what any company did or failed to do.
Every spill on an overflow page now shows the rain recorded at the nearest gauge before it started, so you can see for yourself which spills followed rain and which did not. How we keep the record.
Photographs by Peter Lane, 19 September 2026, 12:01 to 12:46 UTC. Spill data: National Storm Overflow Hub. Annual totals: Environment Agency storm overflow annual returns.